Problem
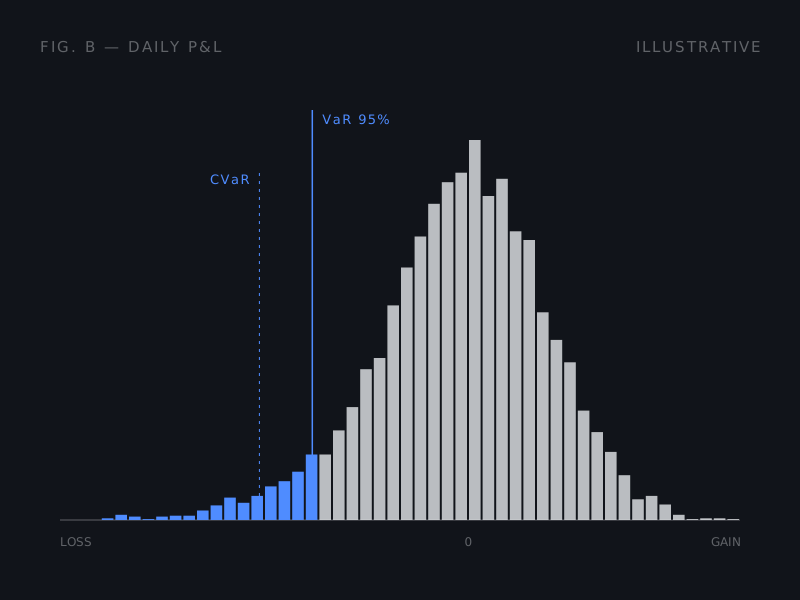
A single Value-at-Risk number hides its assumptions. Historical VaR assumes the past repeats; parametric VaR assumes returns are normal; Monte Carlo assumes your covariance estimate is right. Running all three on the same portfolio shows you where those assumptions break.
Approach
- Returns. Daily prices are pulled from yfinance and cached locally, then turned into log returns for every holding and aggregated by portfolio weight.
- Covariance. A Ledoit-Wolf shrinkage estimator replaces the raw sample covariance, which is noisy and badly conditioned when there are many assets and limited history.
- VaR, three ways. Historical (an empirical quantile), parametric (a normal fit), and Monte Carlo (correlated draws from the shrunk covariance matrix).
- CVaR. Expected shortfall: the average loss given that you’ve breached VaR. This is the number that actually describes the tail.
- Per-holding diagnostics. Annualized volatility, beta to SPY, Sharpe ratio, and maximum drawdown, so the portfolio-level number can be traced back to the positions driving it.
Design notes
The risk engine is a pure-Python package (risk/) with no web dependencies, so each estimator can be unit-tested on its own. The dashboard front end sits on top of it and is still being built.